The Project
I led the design of this brand new project and brought it to live from a highly ambiguous and technical setting, a demo was presented to stakeholders, gaining their recognition and endorsement to progress further.
What I did
User research
Secondary research
Prototyping
Dev handoff
Dev QA
Project Coordination
Cross-functional Partners
Project Coordinator
Regulatory Analysts
AI Analytics Team
Business Intelligence Team
Data Labelling Team
CRM Team
What is our product?
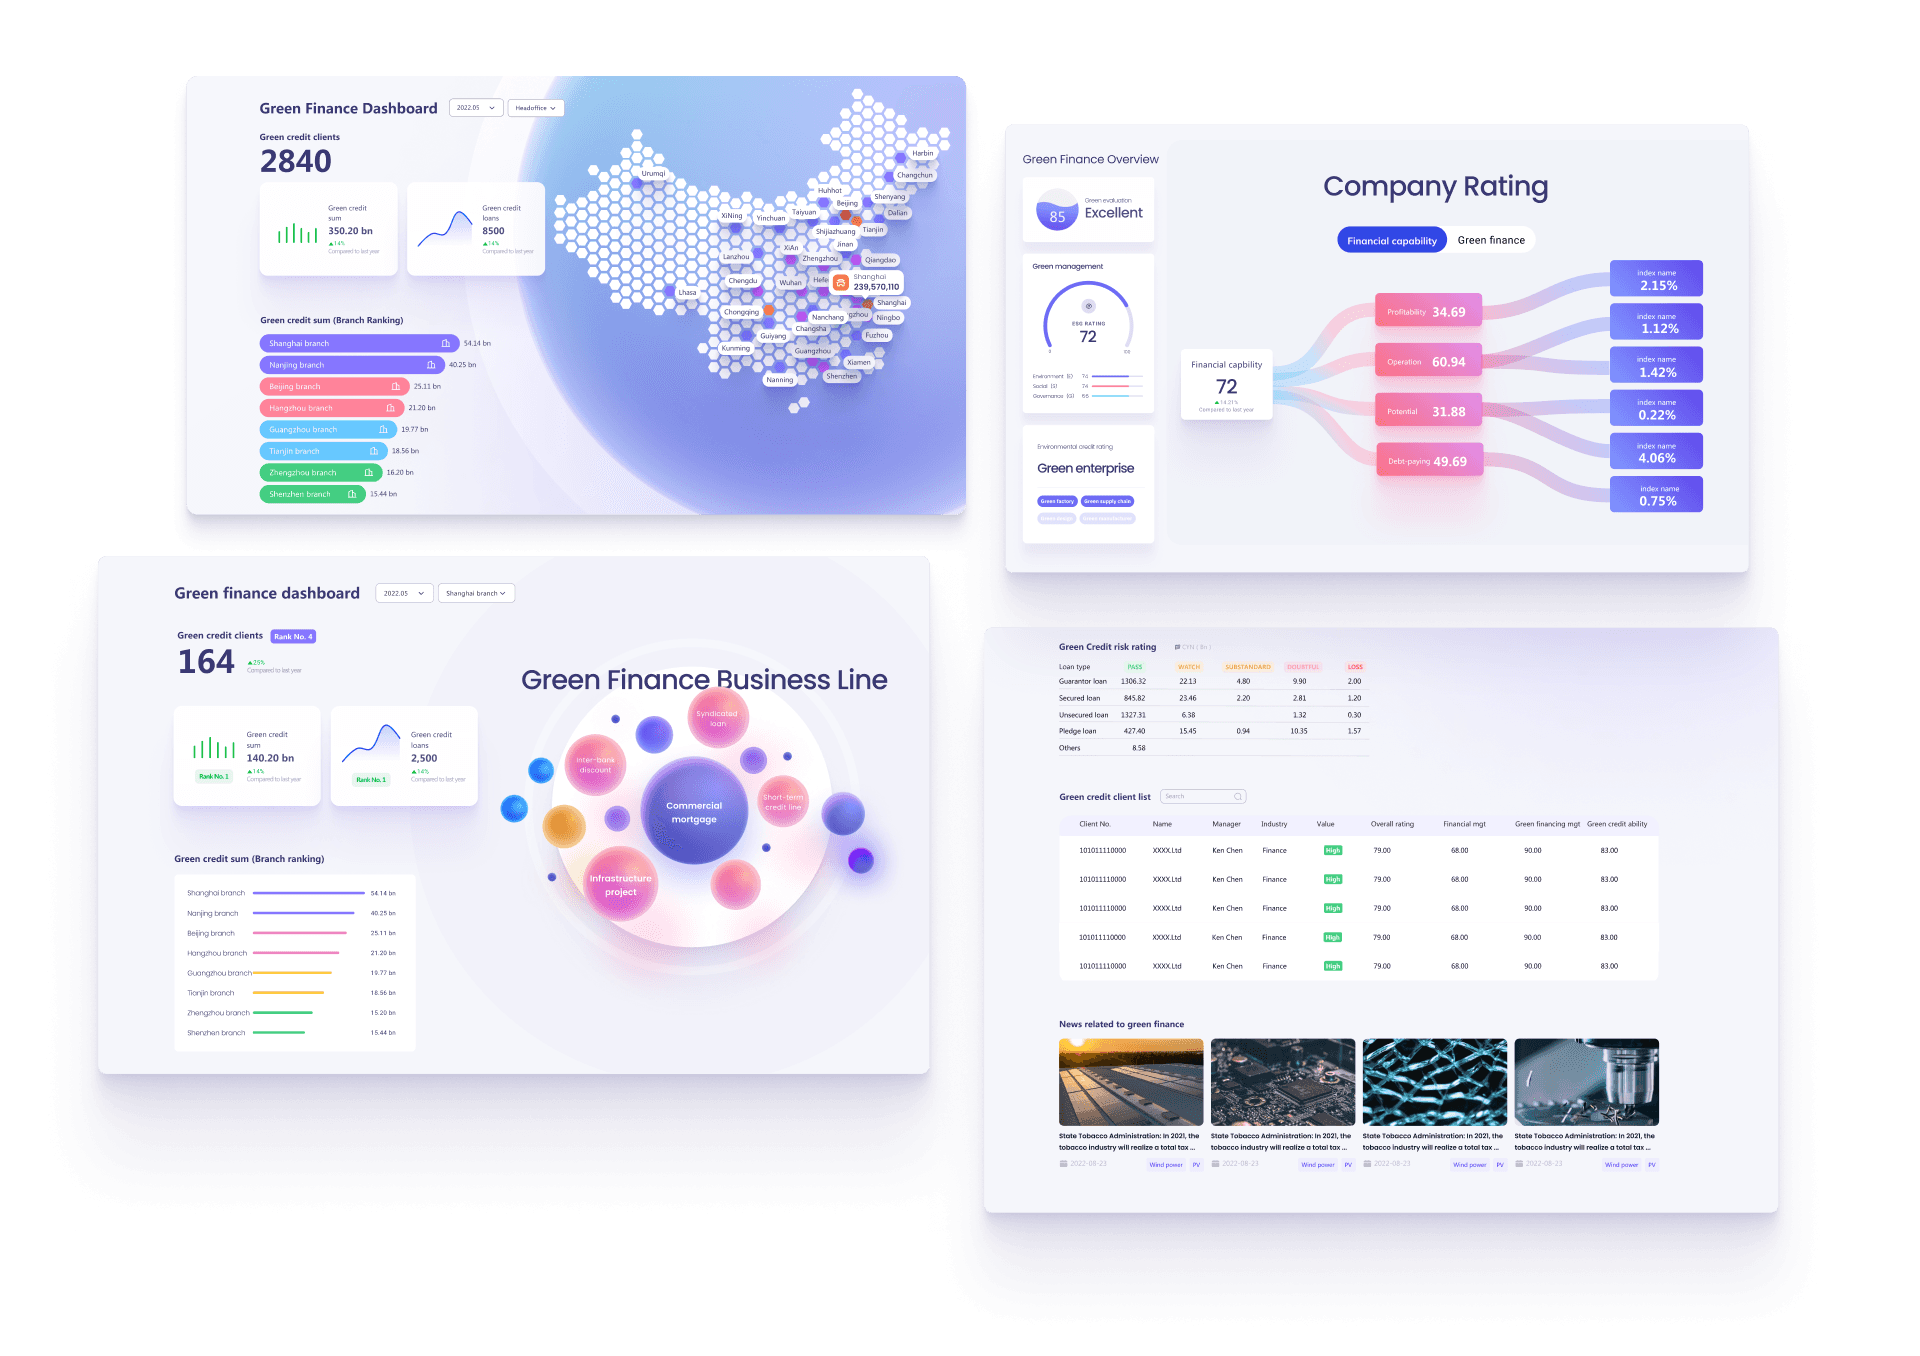
Analytical dashboard assisting stakeholders in evaluating banking performance towards green finance
The Green Finance Policy Landscape
Opportunities
Assist decision-makers to evaluate environmental externalities in a science-based manner
Establishing green rating and green credit information systems is a fundamental task at the heart of green finance. Once the green rating of projects and companies is put into place and applied to the credit information system, it becomes possible to evaluate environmental (positive, negative) externalities in a science-based manner and provide justifications for fiscal subsidies or fines, bank interest rate discounts or increasing credit and bond financing costs.
Specifically, companies and projects rated as green enterprises and projects are able to acquire financing cost advantages of relevant grades in bank loans, bond financing and interest rate discounts according to their green rating results, so as to achieve the objectives of encouraging green investments and restricting polluting investments.
Challenges
Design-driven project with ambiguous user needs & unstructured data analytics
This project was initiated by the senior leader who has foreseen an opportunity to establish green rating & credit information system. Our team was tasked to conceptualize the product and present a demo to the stakeholders. Continuation of the project development would depend on stakeholder interest. It is challenging in 2 aspects:
There was no requirement from users' end, the project was entirely driven by data and product teams.
Data teams had a wide range of data collection, it was up to the product team to select the most relevant and helpful information.
Targeted user roles
Users on different hierarchical levels with varying objectives
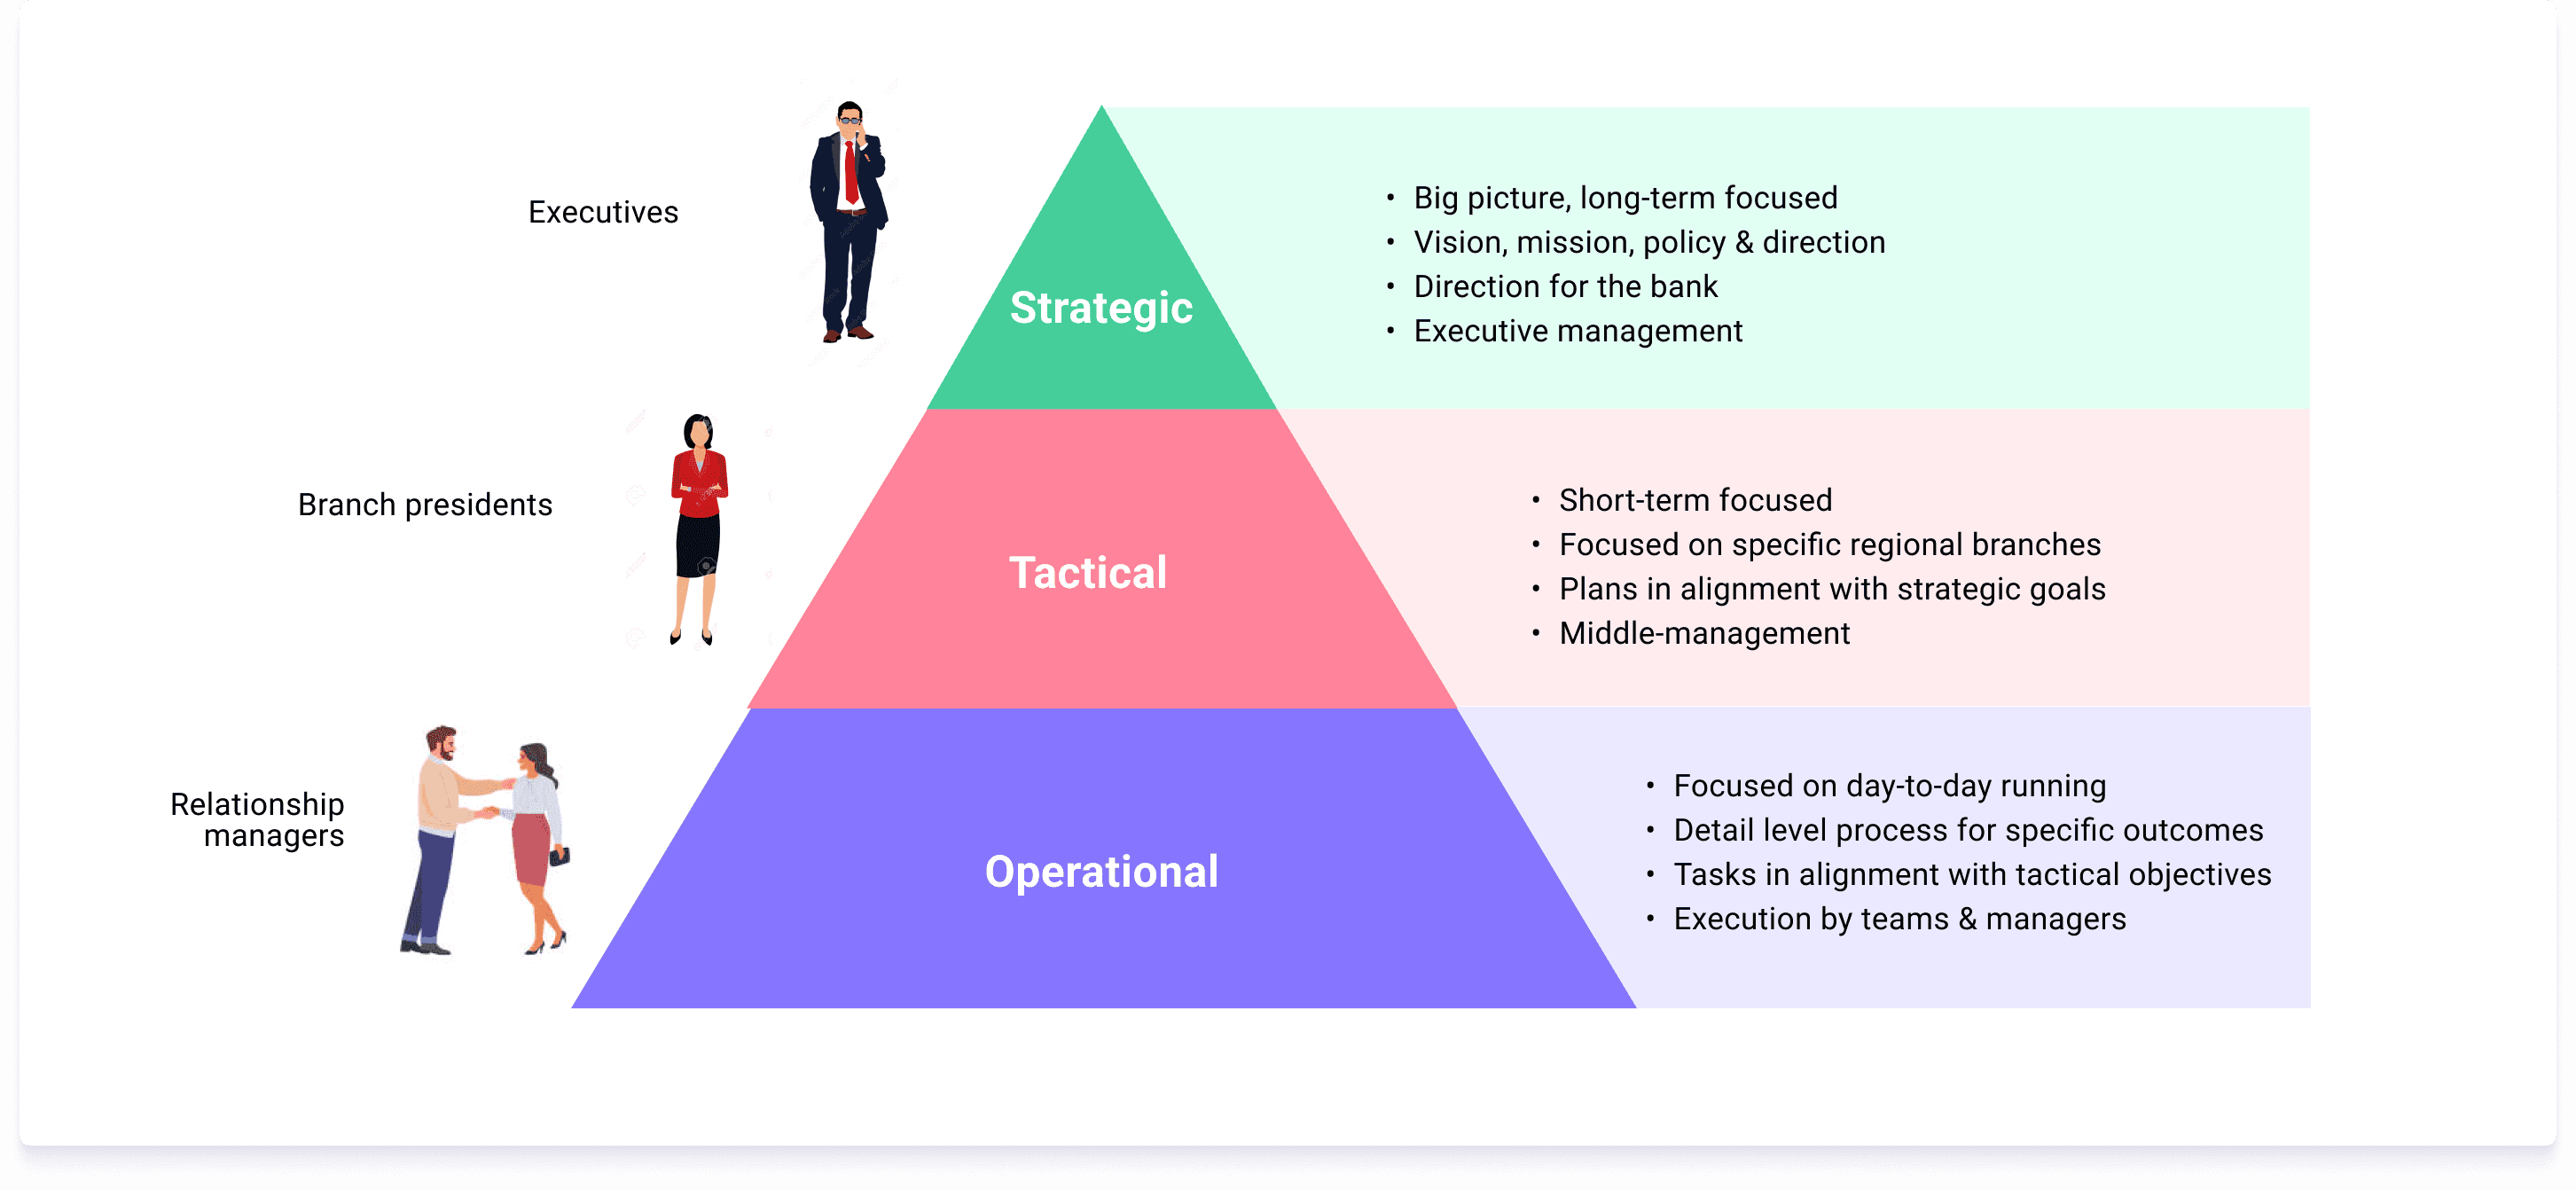
There are 3 key user roles relevant to credit & loan decisions:
Banking executives - strategic level
Regional branch president - tactic level
Customer relationship managers - operational level
User needs
Connect to front-line personnel to overcome unavailability of direct users
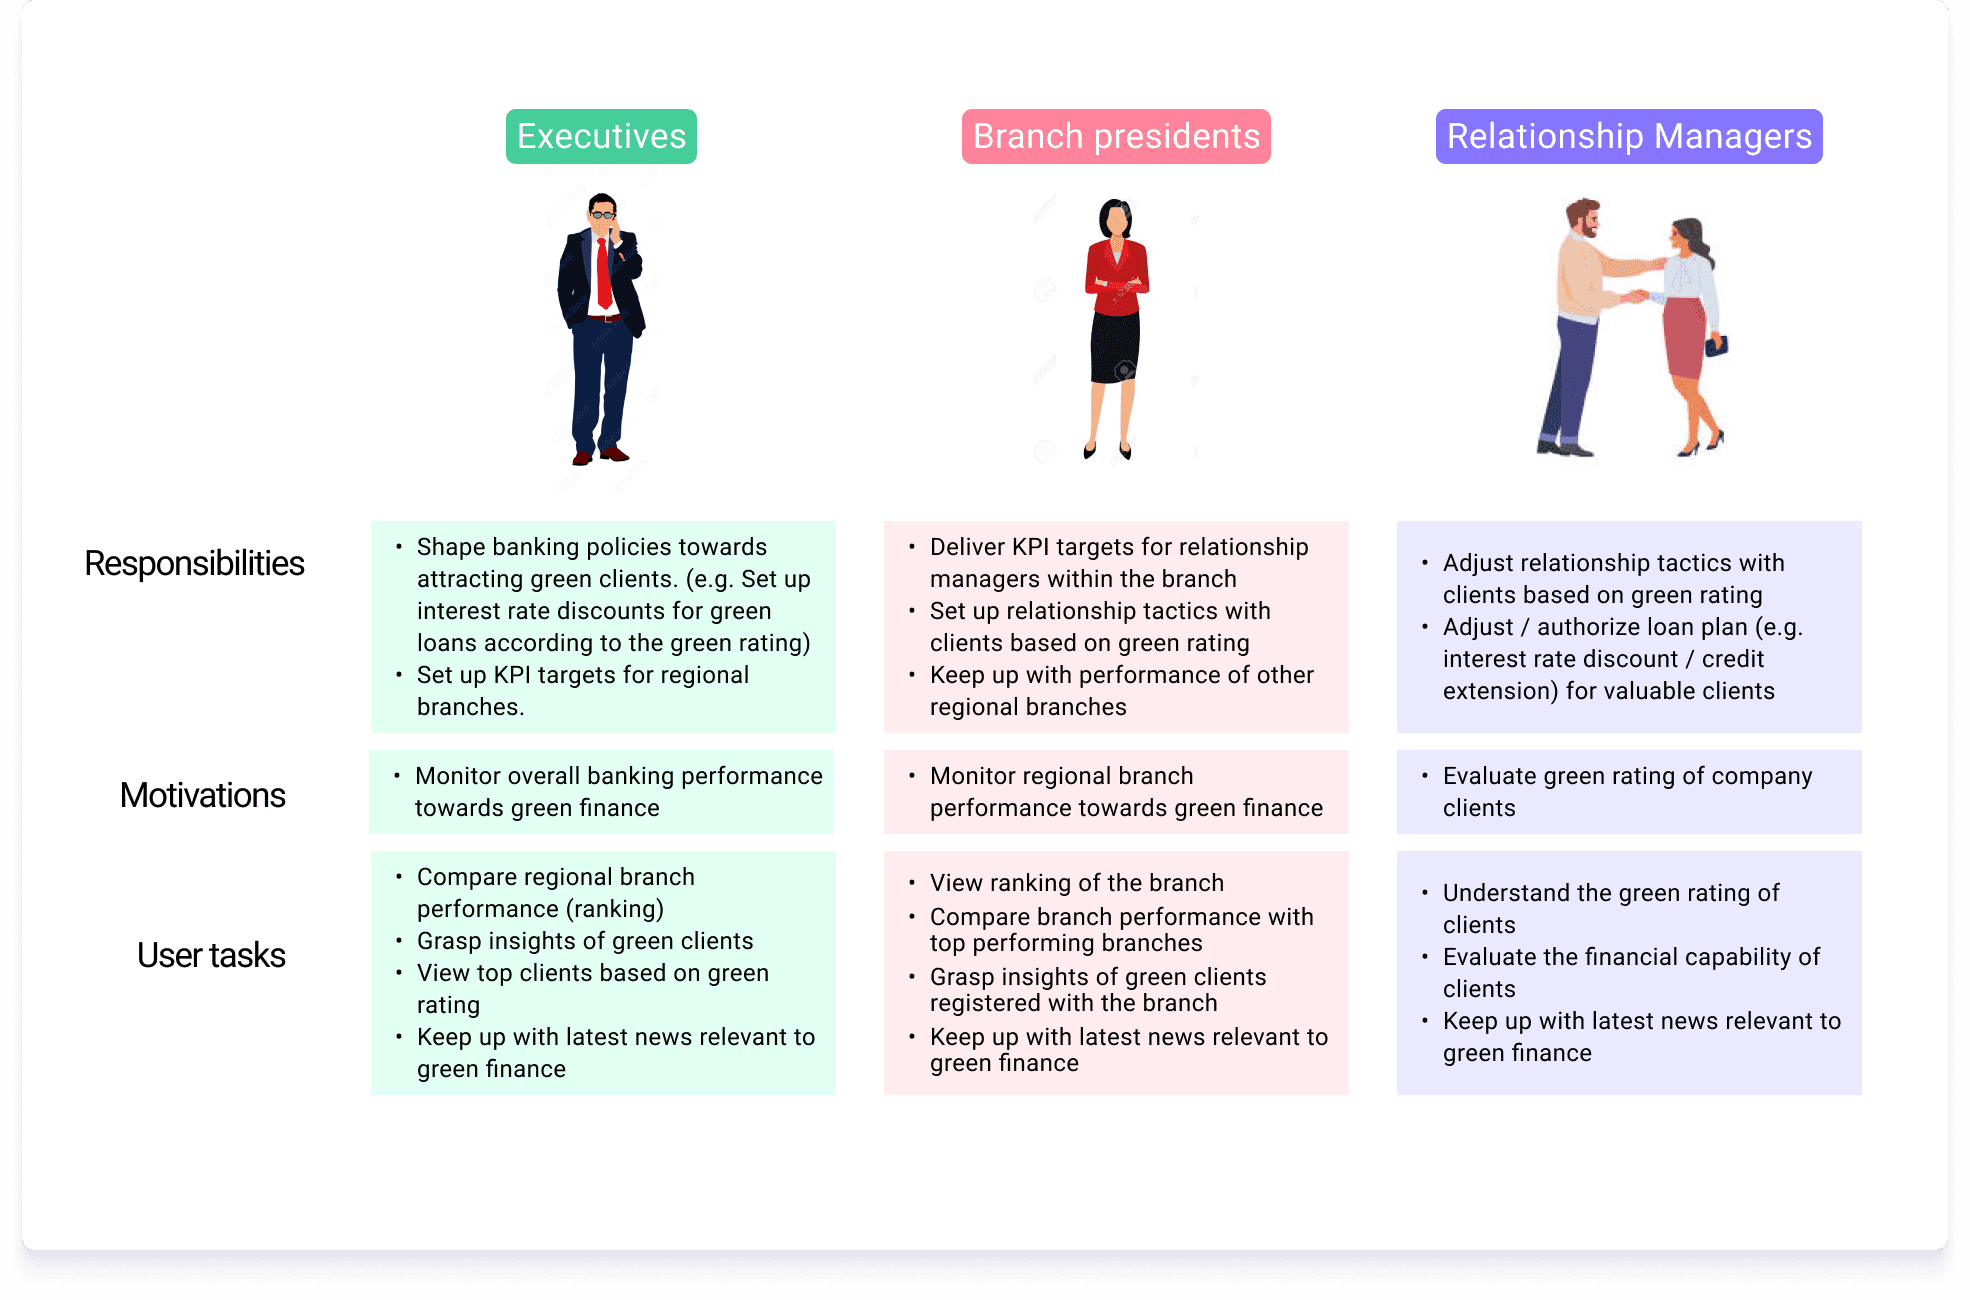
Because our targeted users are not accessible due to their seniority and busy schedule, I partnered with regulatory & financial compliance analysts who work alongside our target user roles to understand their daily responsibilities and engagement in the organization. We worked together to develop lists of user motivations and user tasks.
Leveraging available data & contents
Collect sample data
At the time, most teams were still working on model training and data processing in the testing environment, there was no actual outputs available. Since it's important to understand the scope and formats of available data, I contacted our data supplier teams to provide with documentations of sample data. This includes:
Green finance measurements from Business Intelligence team
Client rating model from AI analytics team
News contents from Data Labelling team
Align data metrics with dimensions & lineage
From the documentation provided by our data supplier teams, we arranged data metrics against relevant dimensions or lineage (for modelling) which gave us a clear idea of the available scope of our data and rationale behind data processing. Below shows some snapshots of the data arrangement.
Scoping our design
Select the most relevant metrics against dimensions & choose the optimal method of visualization
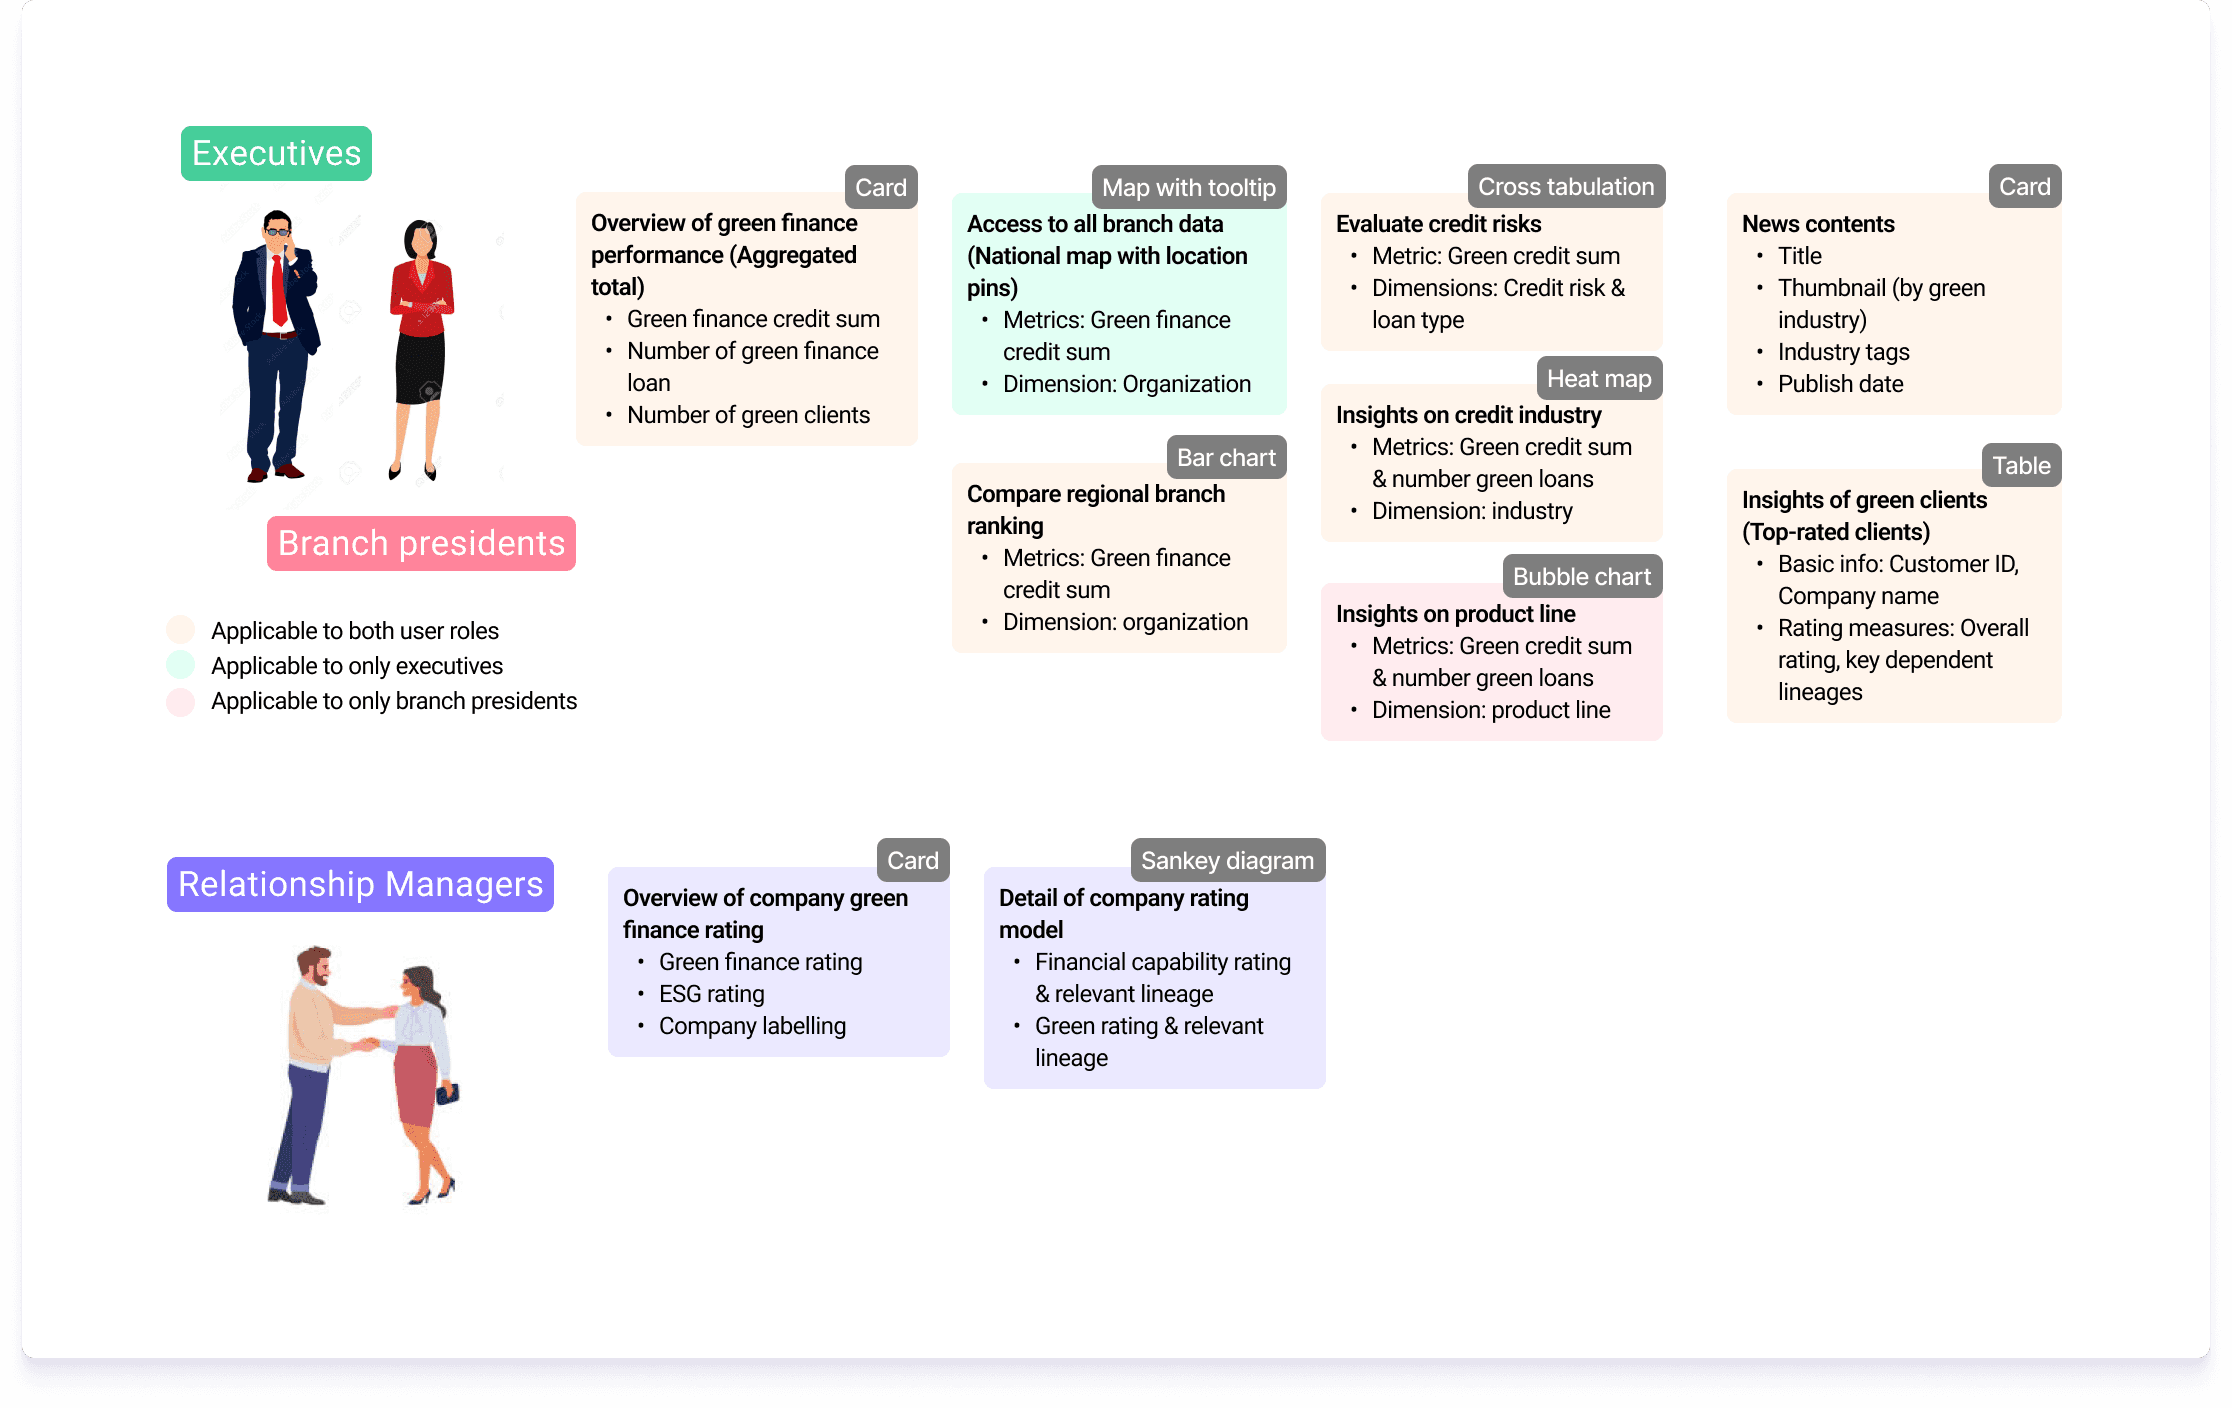
With the help of regulatory & financial compliance analysts, we listed out the key metrics that will help our users make business decisions. Most of the considerations stem from industrial and empirical knowledge.
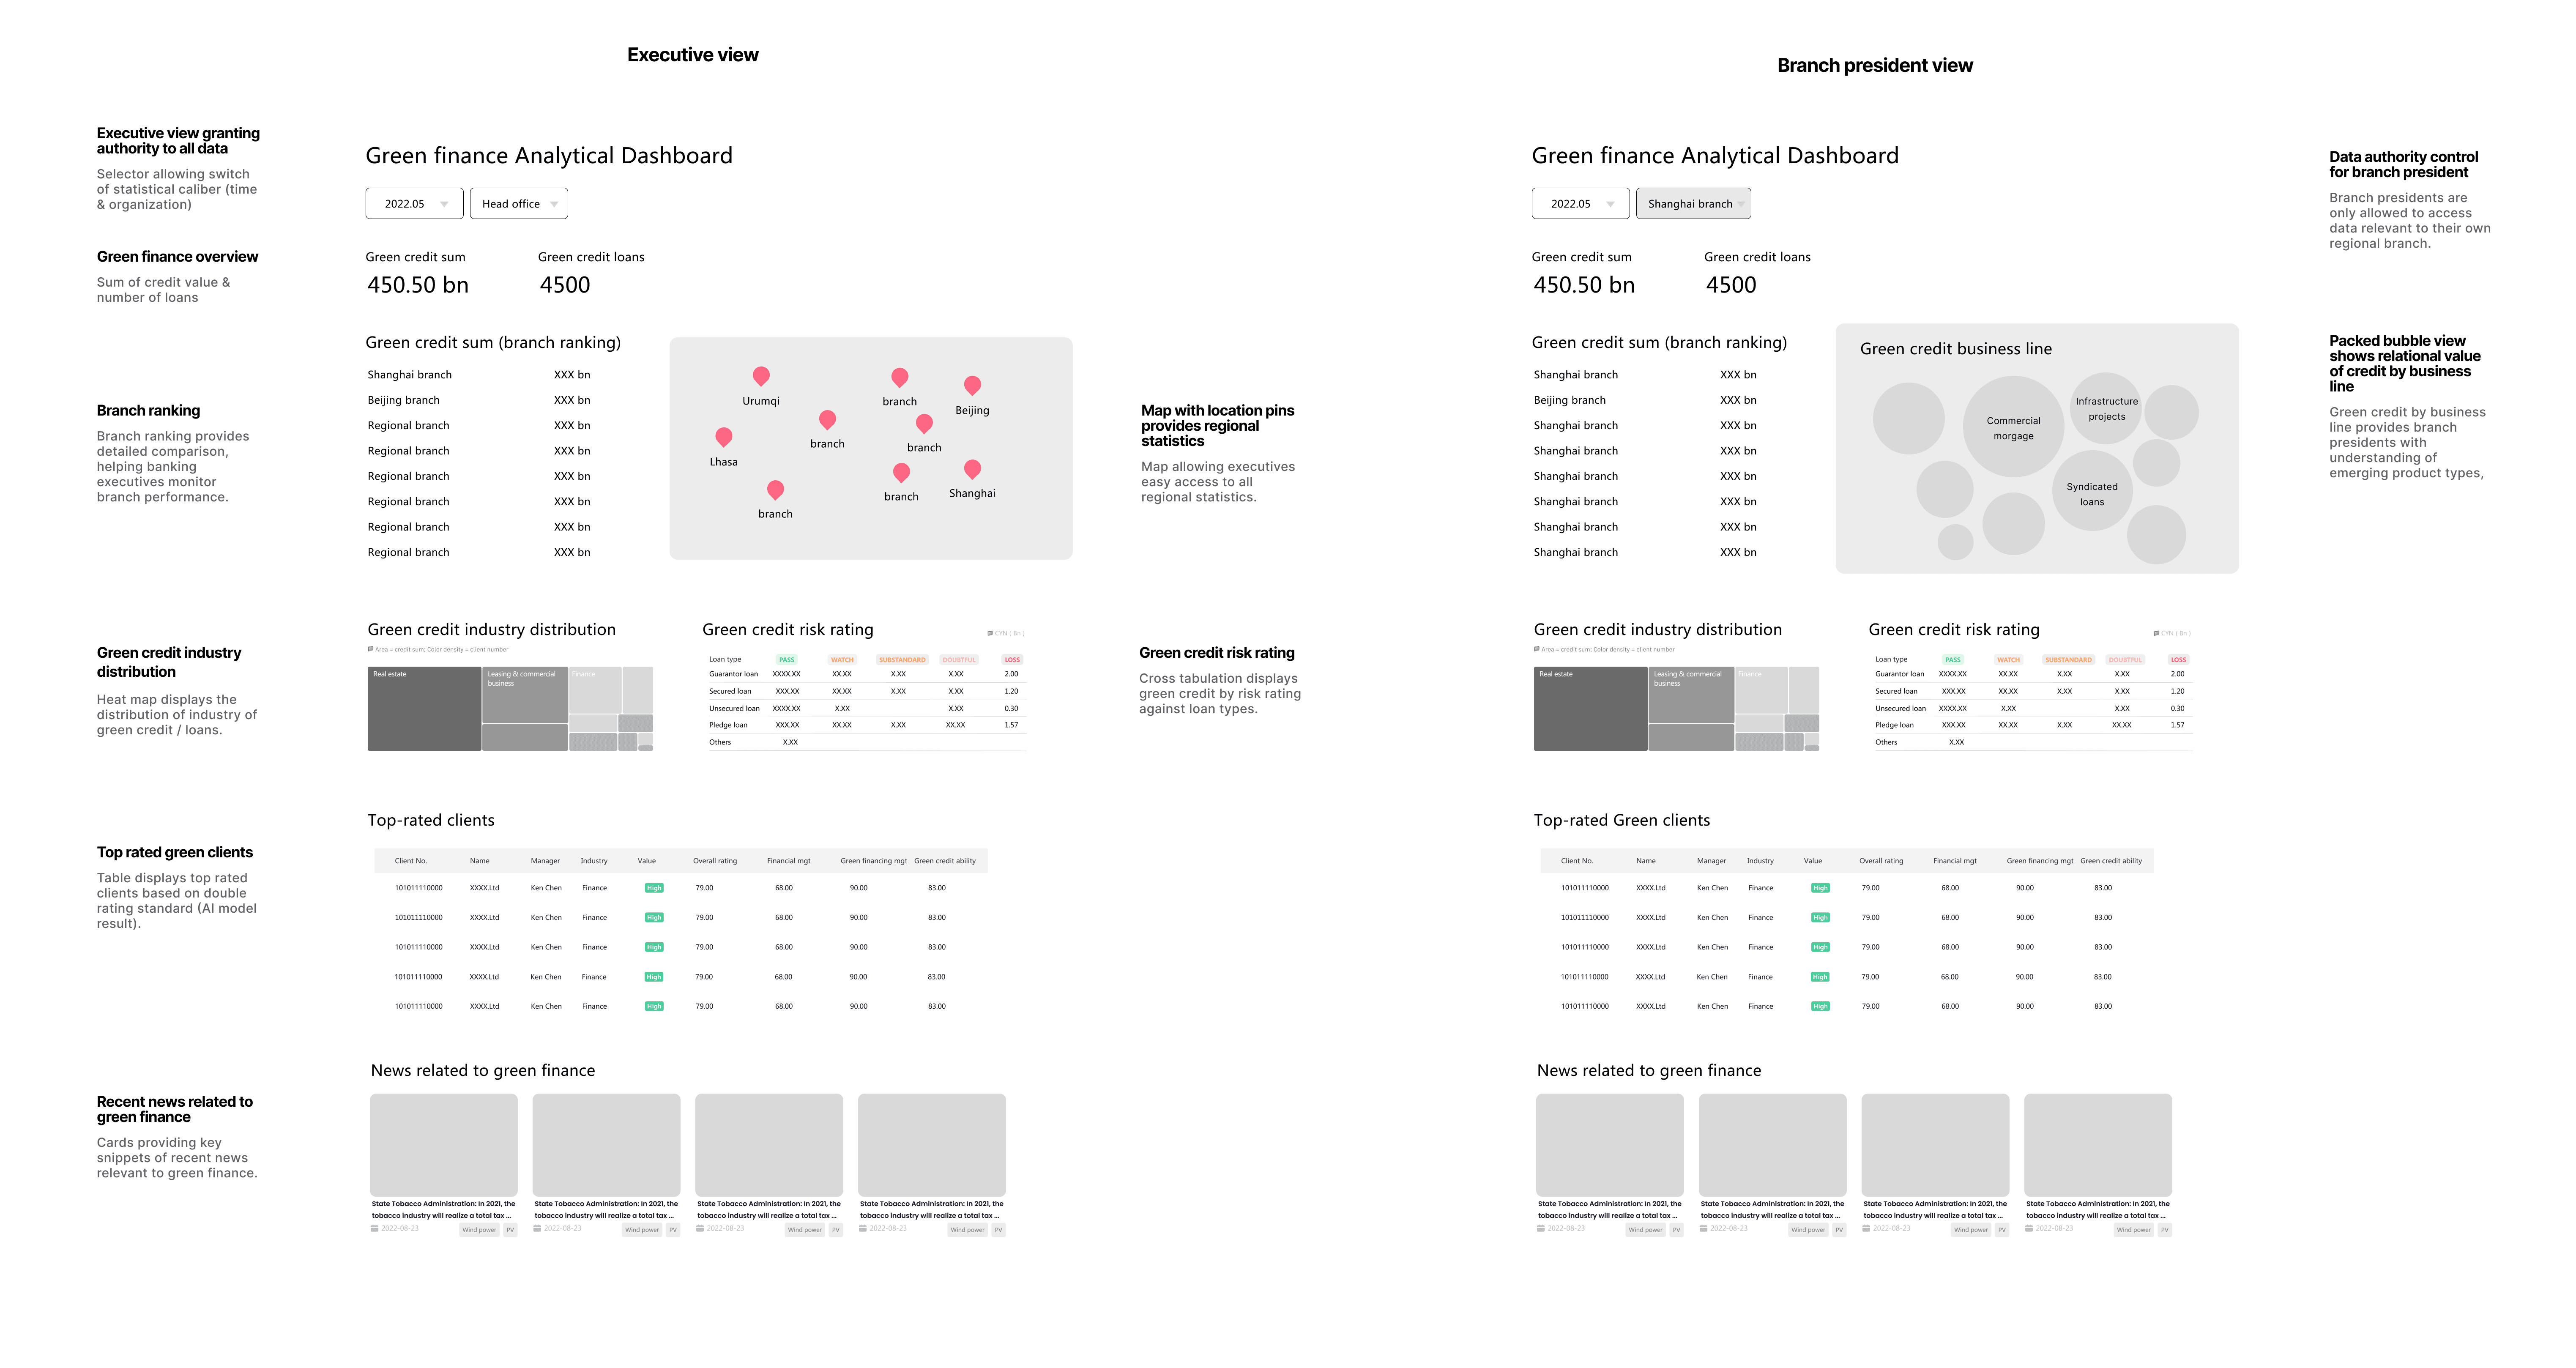
Stand-alone analytical dashboard with data authority control
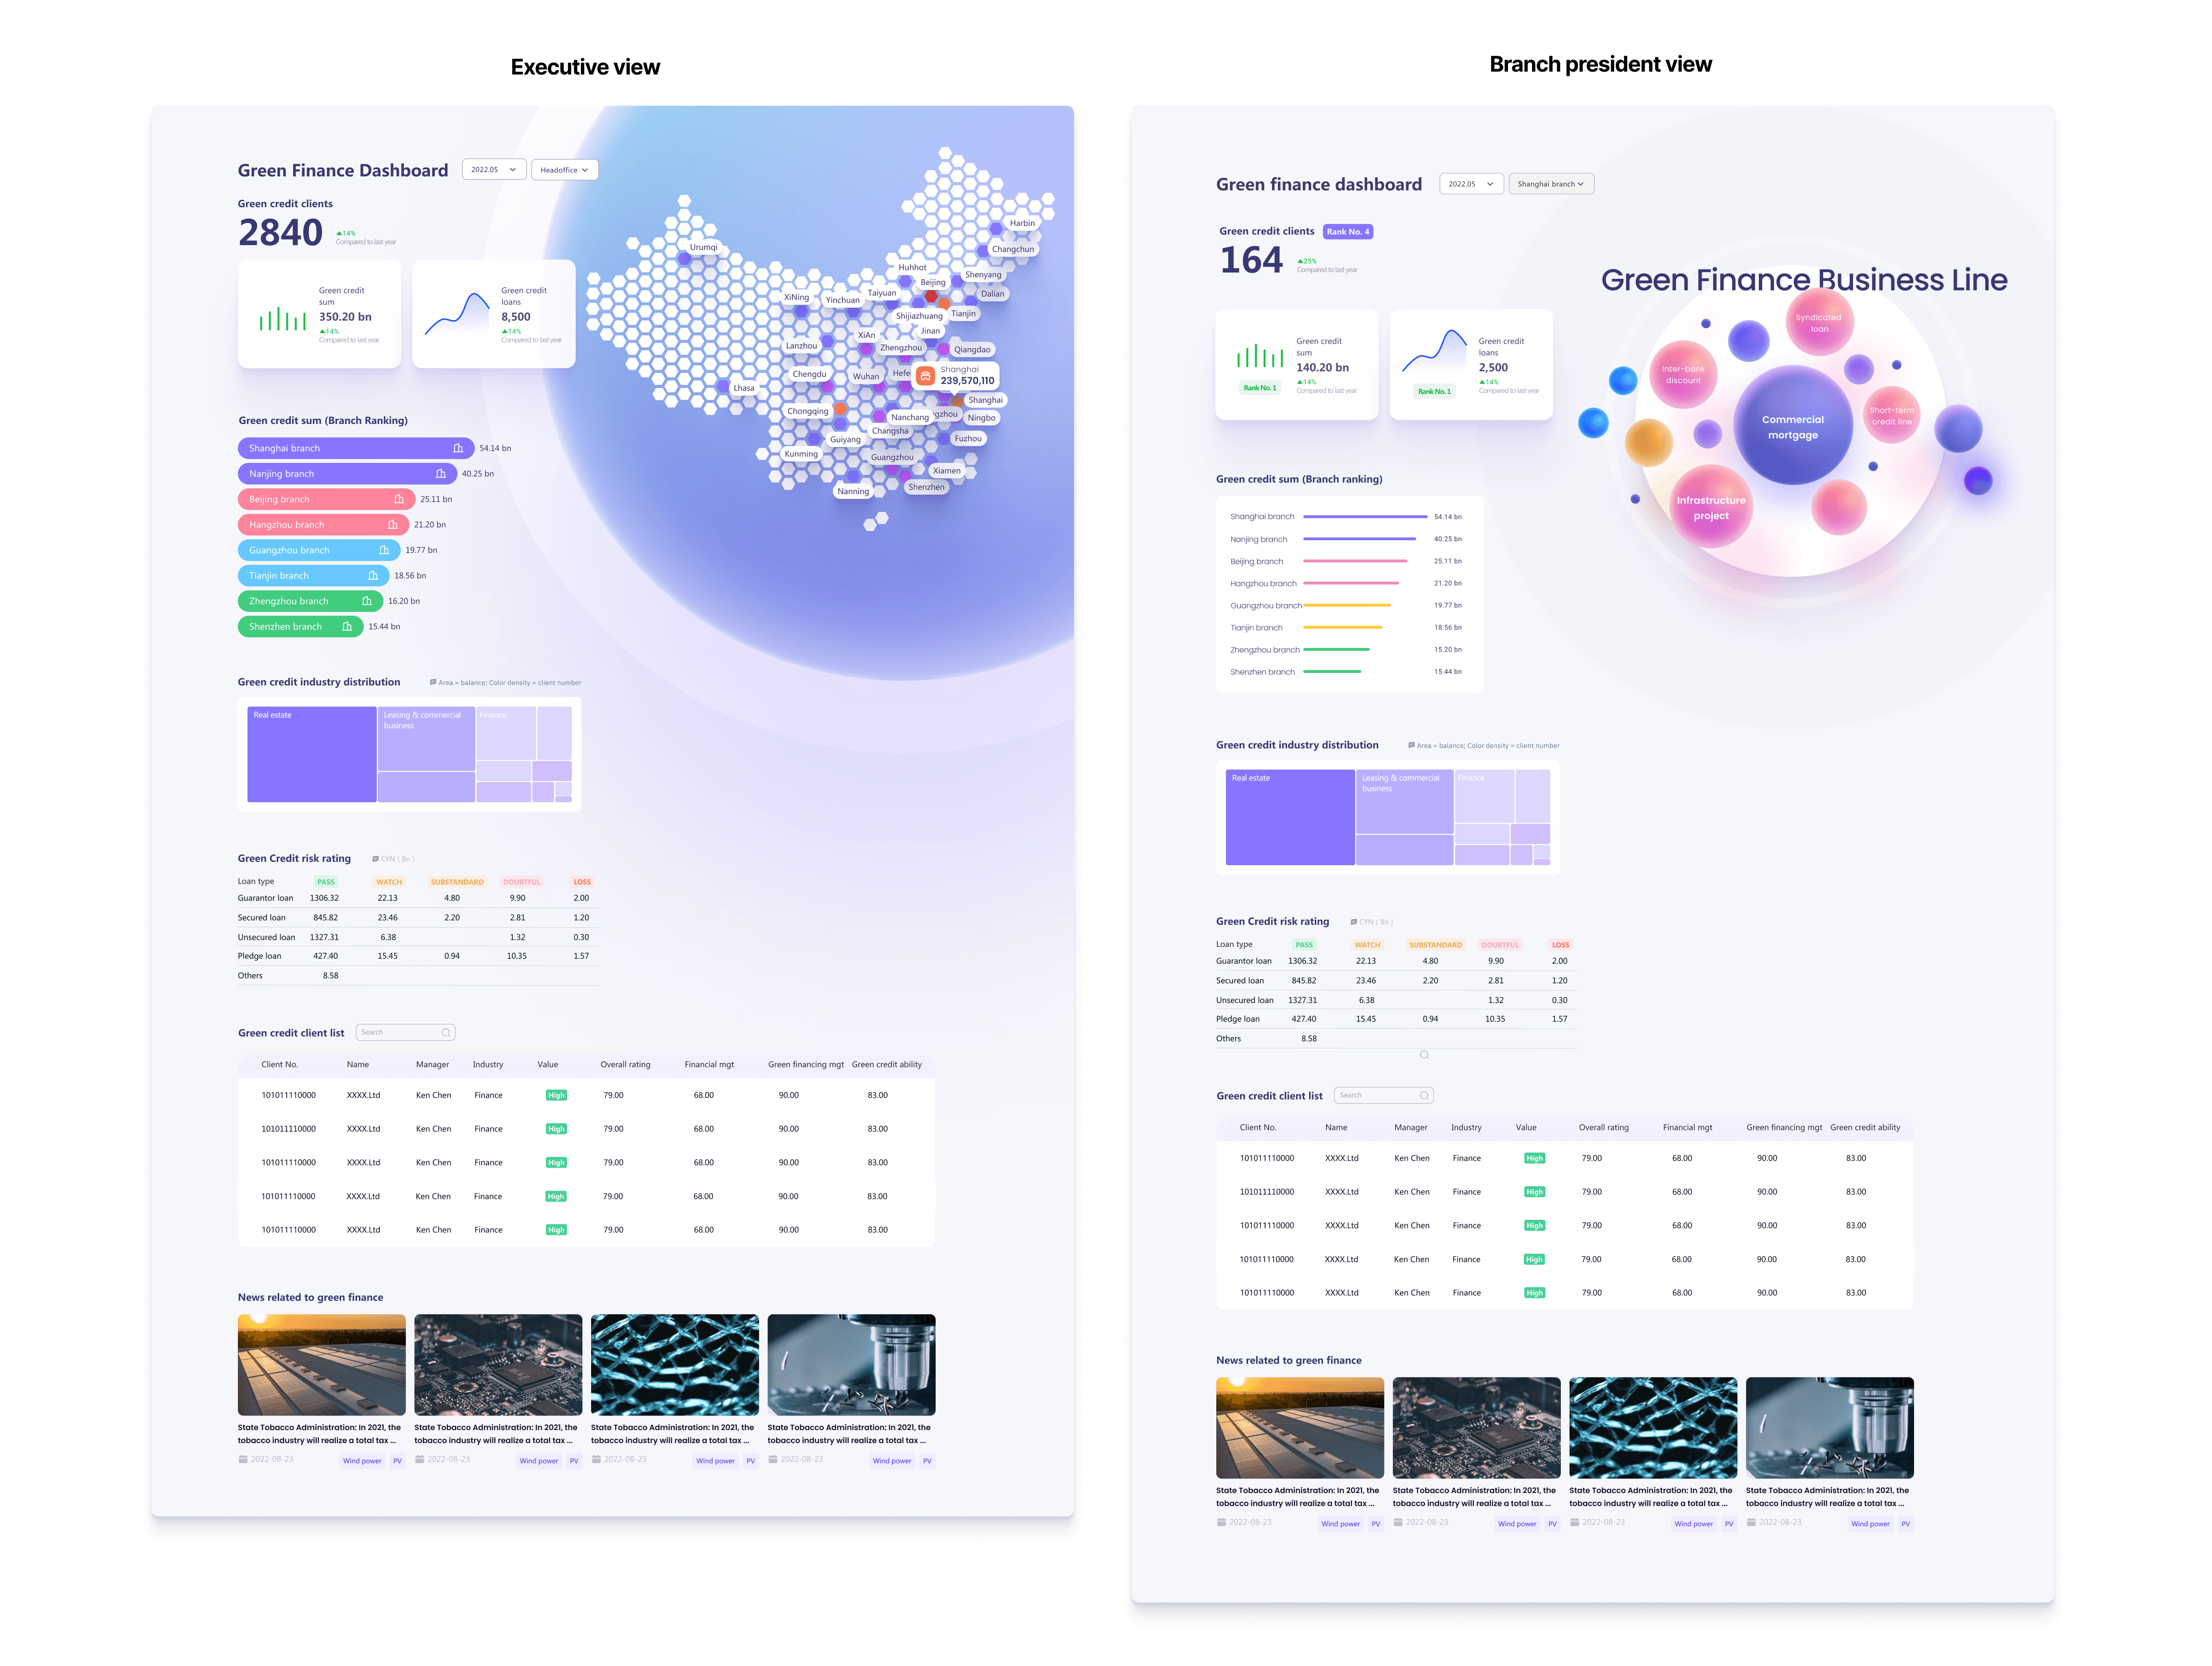
Based on our user research findings, banking executives and regional branch presidents care about overall performance of the bank and specific branch respectively. We designed a stand-alone analytical dashboard with data authority control where executives are allowed to view data for all branches (including aggregate data), and branch presidents are allowed to view data related to the specific branch.
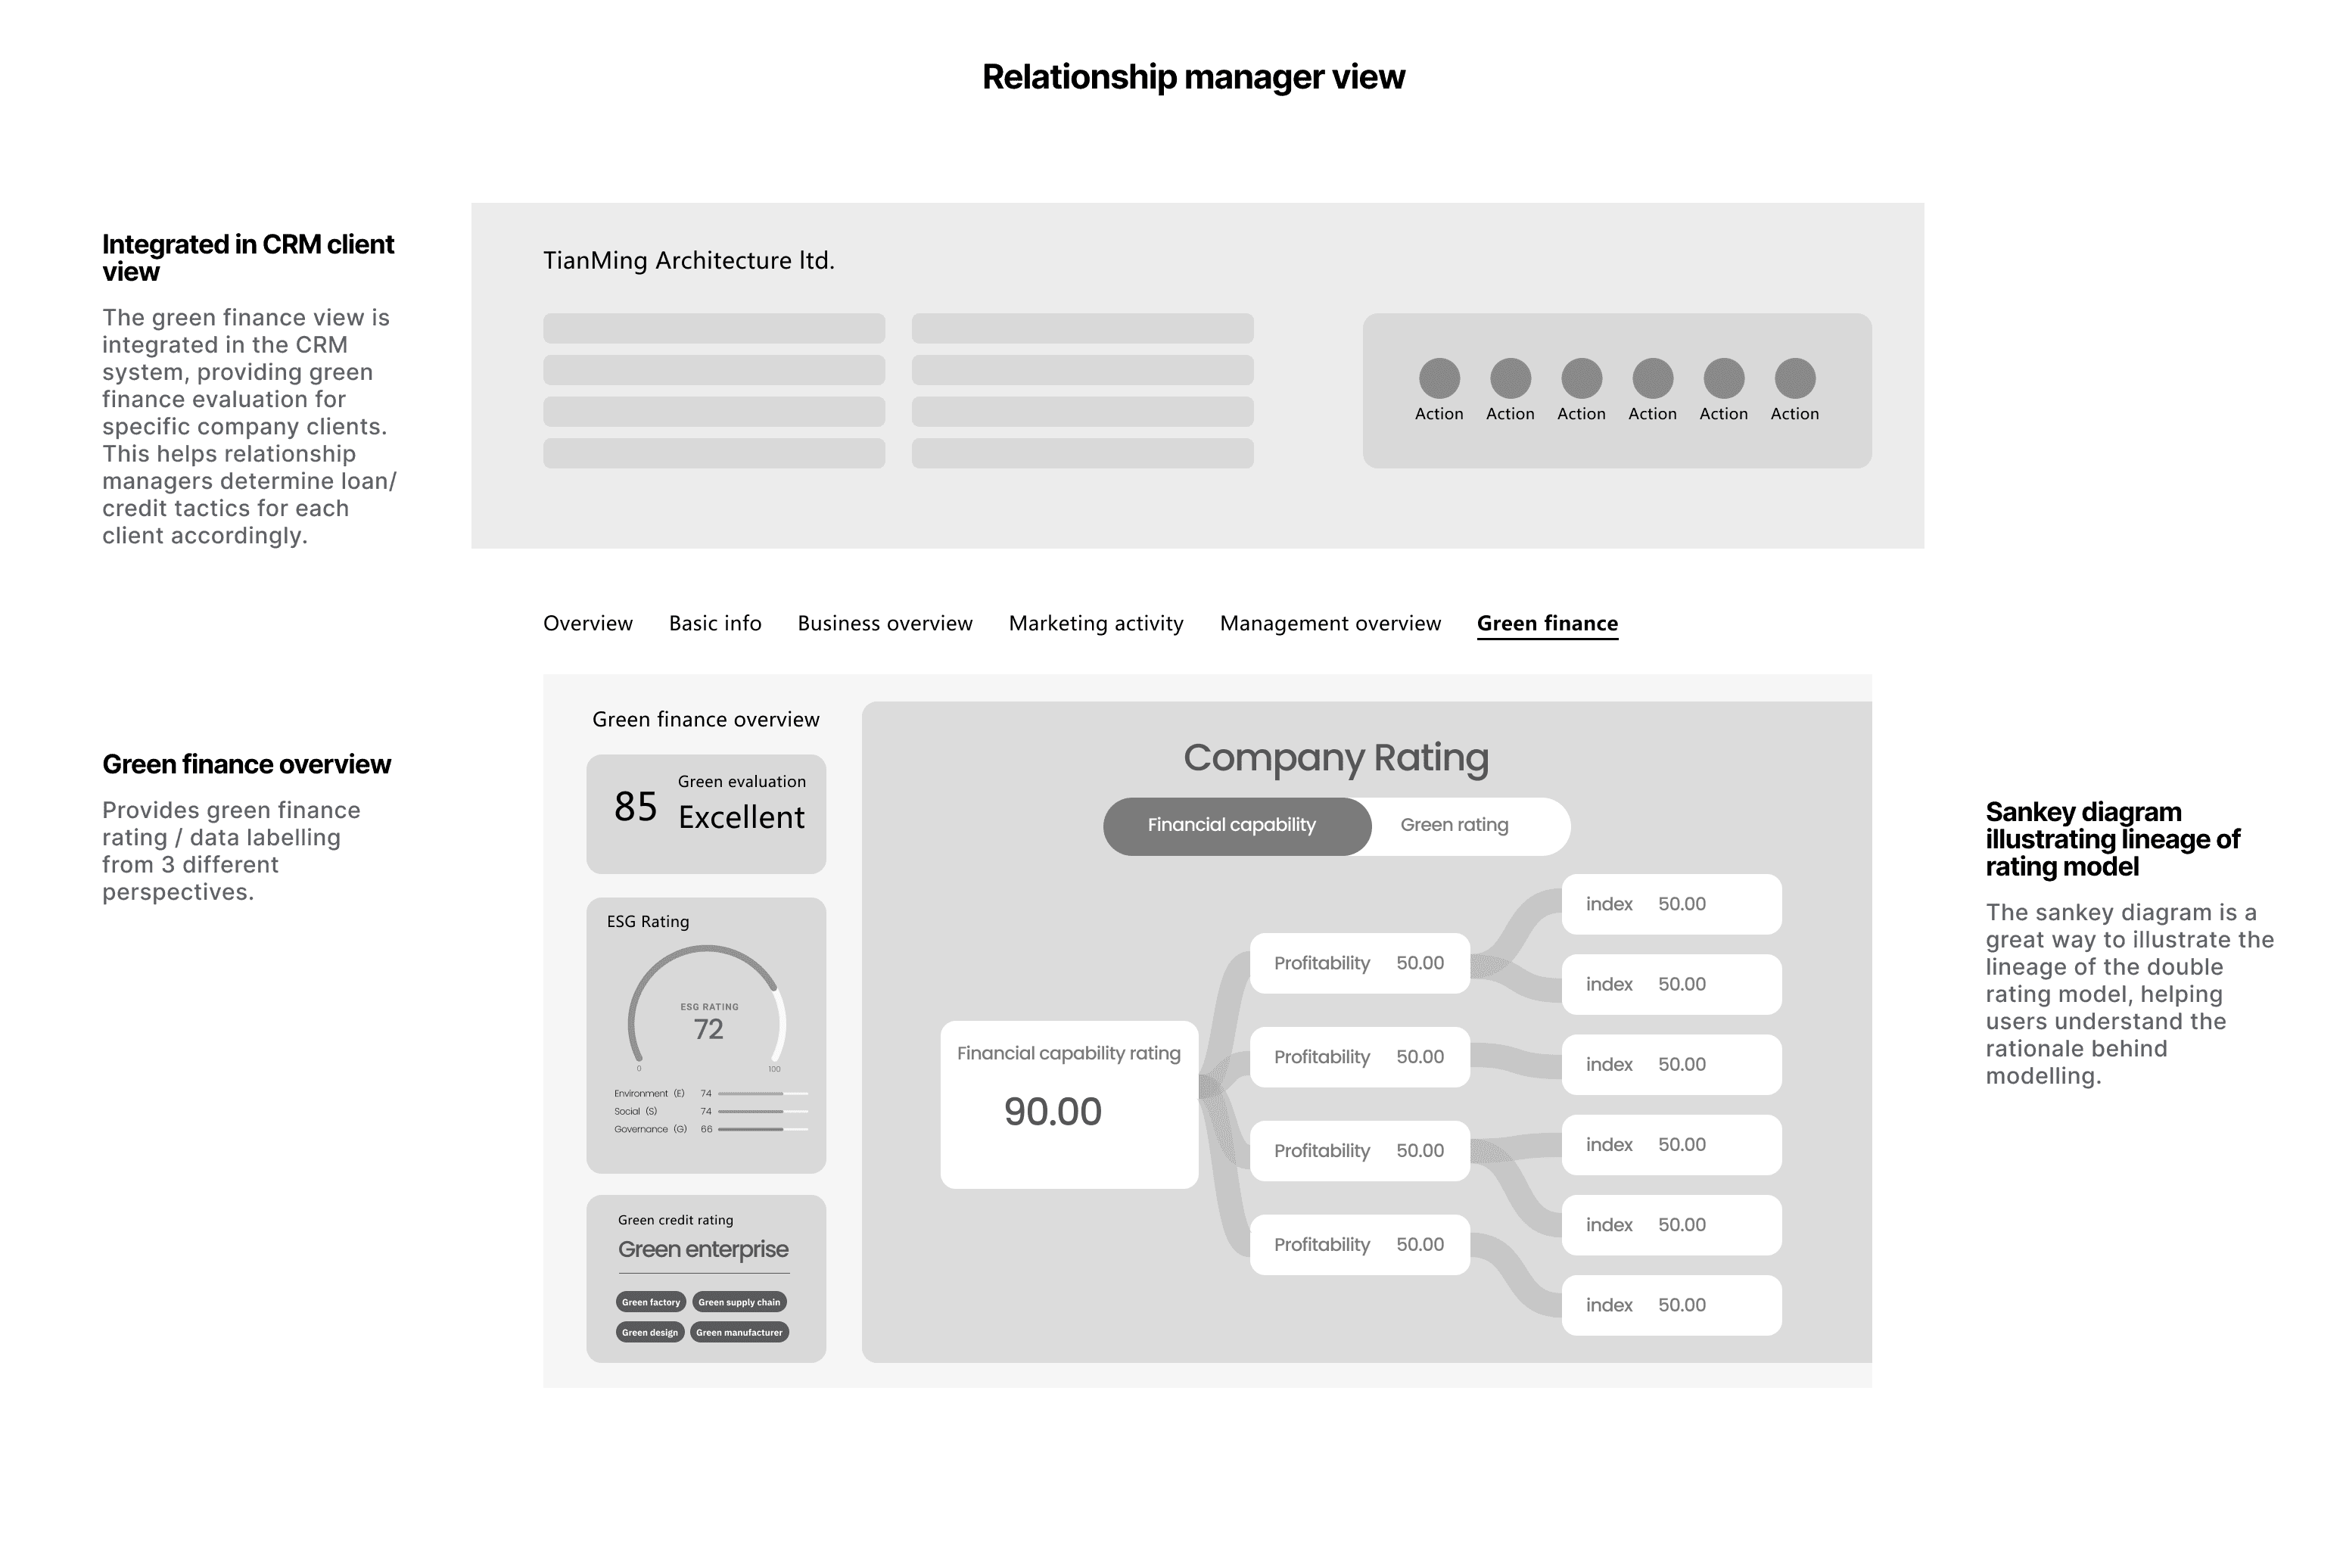
Applet integrated in CRM system providing client rating overview
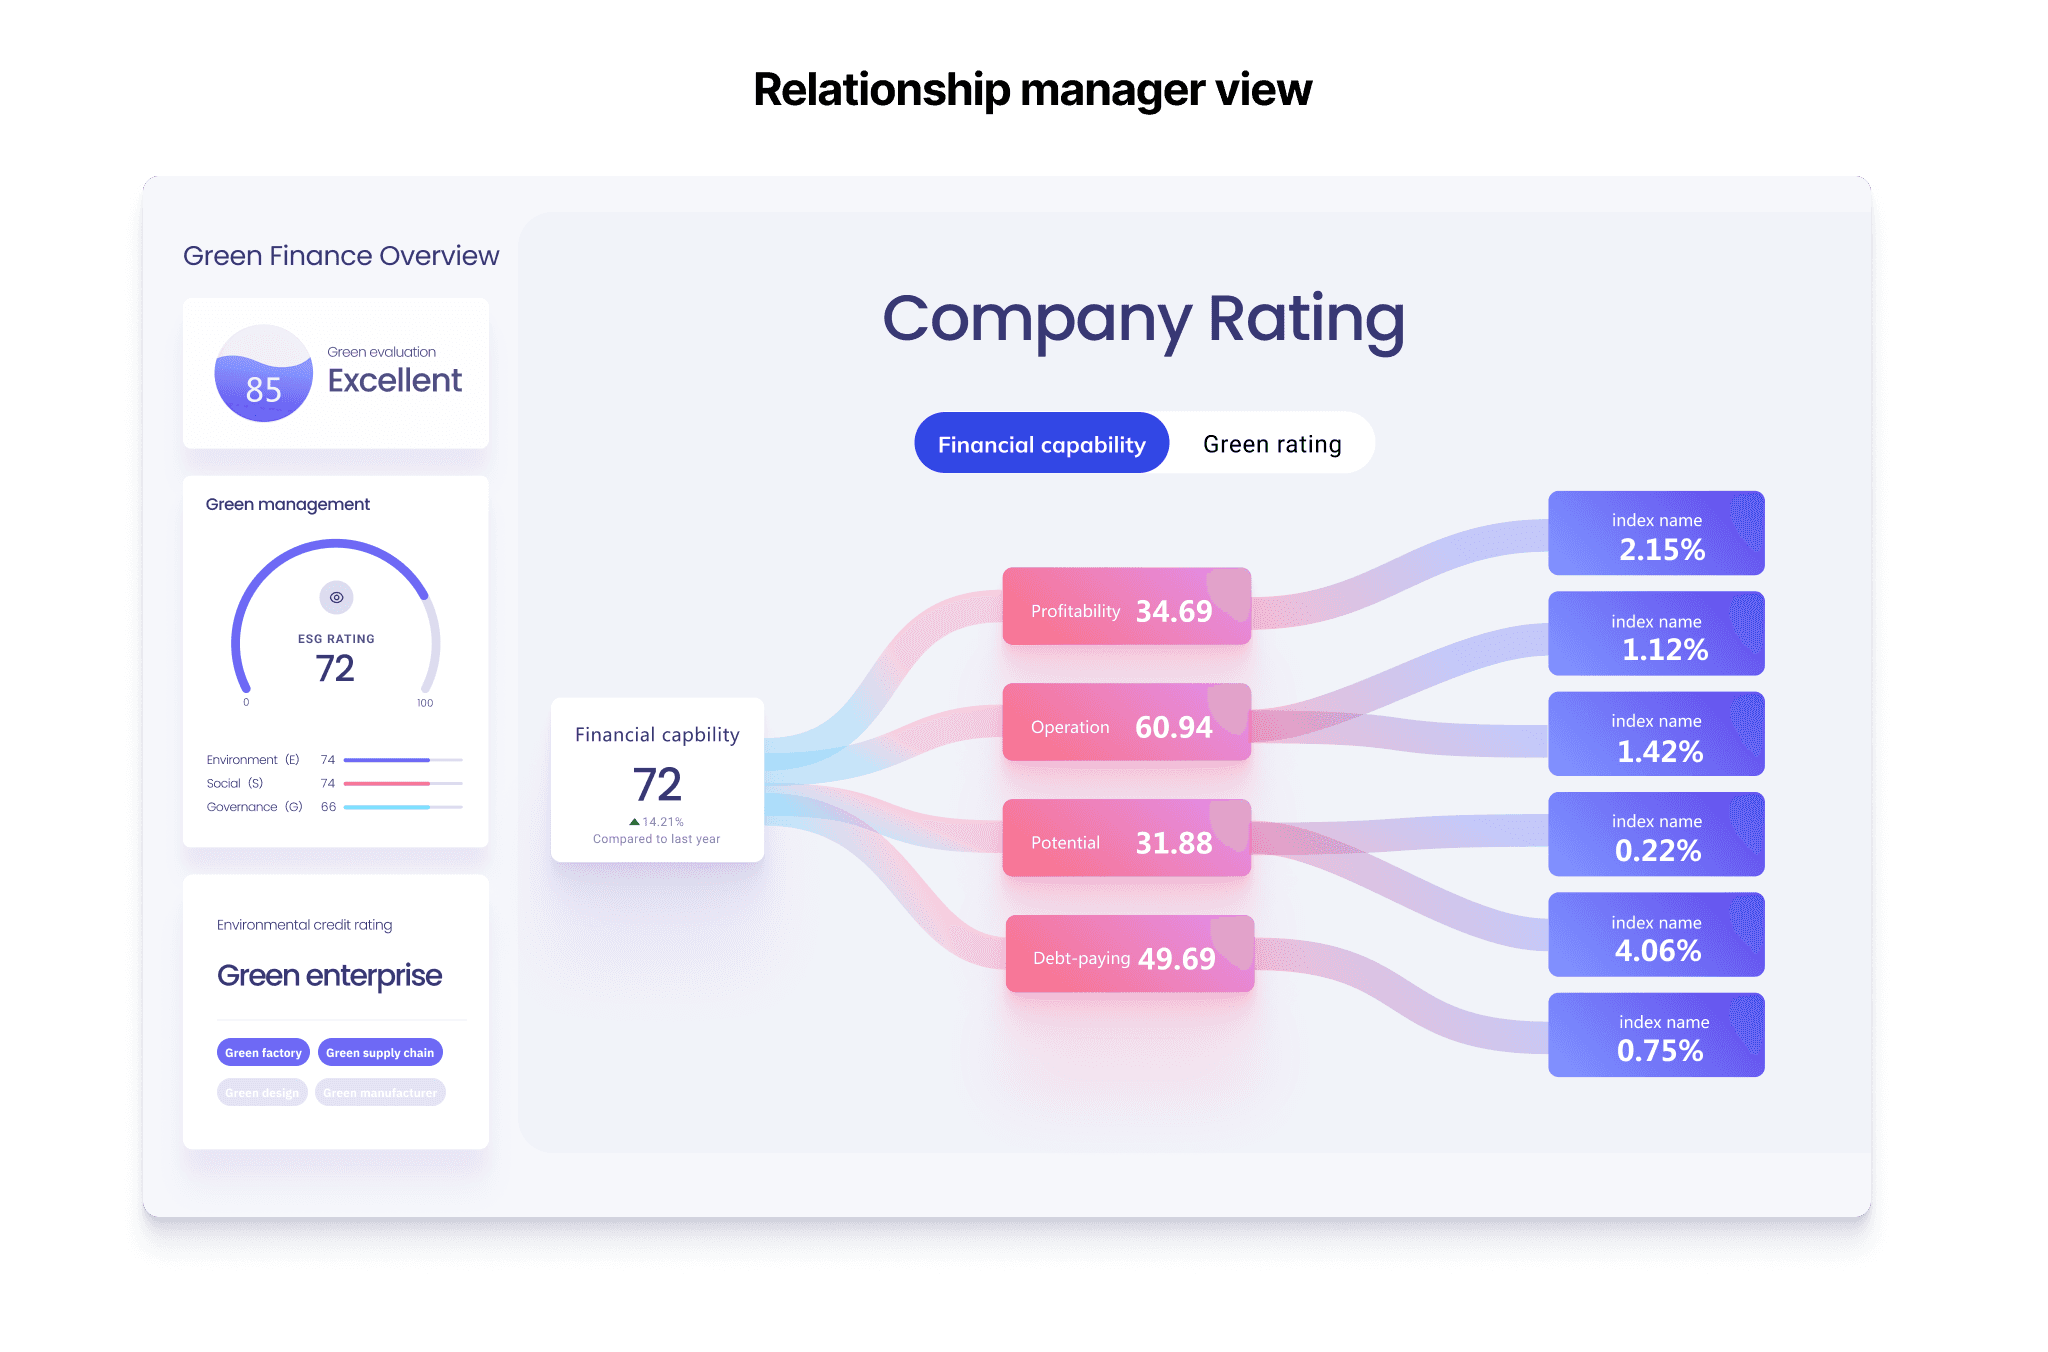
The green finance overview is integrated in the CRM (Customer relationship management) system, providing green finance rating for specific company clients. This helps relationship managers evaluate company value and adjust loan and credit tactics accordingly.
Specifically, companies and projects rated as green enterprises and projects are able to acquire financing cost advantages of relevant grades in bank loans, bond financing and interest rate discounts according to their green rating results.
Visually appealing data visualization to hold audiences' attention & effectively convey information
Aesthetically correct presentations can increase user engagement, create a more positive perception of the information presented, increase the acceptability of the visualized data and increase trust.
Successful stakeholder demonstration leading to endorsement of launch
After the design phase, our senior leader brought our prototype to the stakeholder for demonstration. The presentation successfully sparked stakeholder interest to bring this product to live. This gave us the green light to start development and implementation.
Coordinating development process with multiple cross-functional teams
This project involved a great deal of cross-functional collaboration, where contents & data is supplied by external teams. It was important to understand what kind of connection and docking method needs to be established. The important thing here is that we need to grasp what may affect the progress of the project.
As a generalist, I also participated in project management, keeping constant communication with several external teams. Below shows a snapshot of project management documentation.
Success metrics
Tracking user engagement & satisfaction
Going forward it is important to track certain metrics to measure the success of this design. These could include:
User engagement
User scale: Number of visitors (per day)
Frequency of visit: Number of visits per user (per day)
User role analytics (seniority, functions etc)
User satisfaction
Overall satisfaction rating
Perceptions against key measurements
— Ease of understanding (to validate the clarify of information)
— Level of usefulness (to validate the effectiveness of our selected data)

